Task Completion Time as low as 24 hours
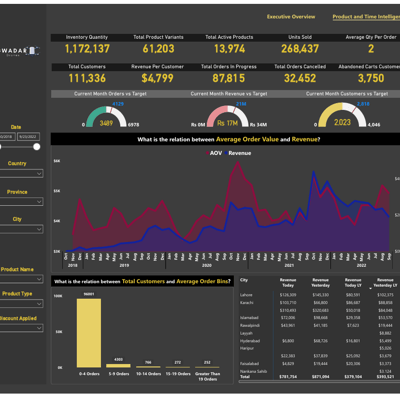
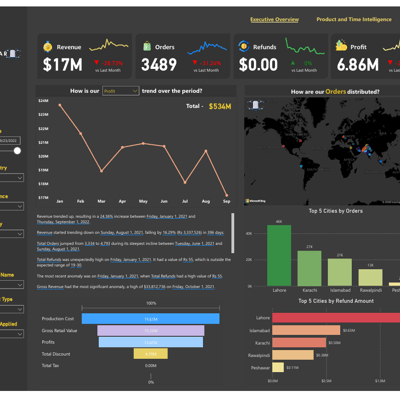
Power BI Portfolio – Visual Insights, Real Impact
Due to NDA restrictions, the showcased work represents only a portion of my capabilities. Let's connect to explore how I can deliver the full value to your business.
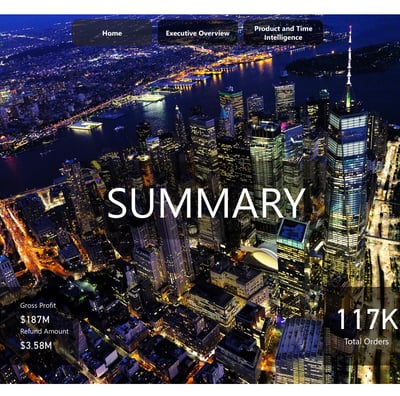

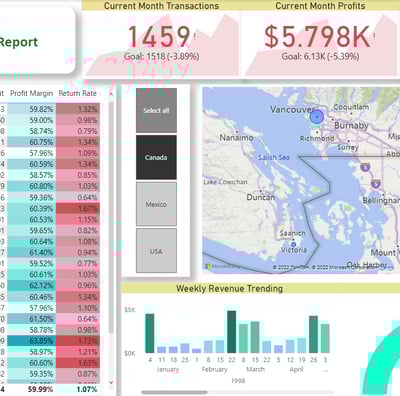
(NDA Compliant)
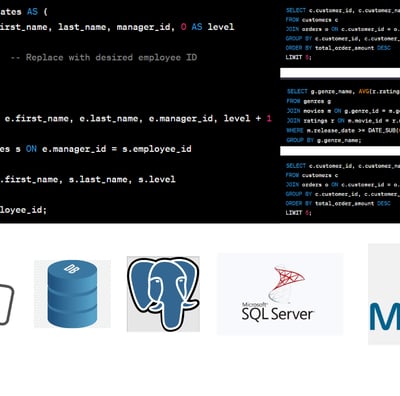
Azure Portfolio


Azure Administration
Certified Microsoft Azure Administrator.


Azure Databricks
Engineering pipelines to optimize performance and drive automation. Certified Databricks developer.


Azure Datafactory & Synapse Analytics
Experienced developer and consultant on these tools.
Azure Resources Reporting
Custom connector for Azure resources data while reporting on Power BI.
The data solutions architect transformed our reporting capabilities, delivering insightful dashboards that enhanced our operational efficiency and compliance. Highly recommend their expertise!
John Doe

★★★★★
Delivering scalable business intelligence and reporting solutions.
© 2025. All rights reserved.